The digital transformation of maintenance in Rai Way: a use case under study

In a dynamic economy, product or service providers recognize the need to transform “digitally”, require the ability to scale, align and adjust production capacities quickly in response to market demands.
Connecting previously unconnected machines or plants to intelligent data systems and, in turn, using the generated data to better make better use of existing ones, are the most productive investments because they are seen as the foundation on which to start the modernization of the factory or service company.
At the heart of the digital revolution in manufacturing are several enabling factors:
• the corporate evolution of the “data-driven” culture: Big Data and Analytics are changing the face of companies, suppliers of products and services want to access the data generated by machines to monitor quality control in real time, improve overall effectiveness of Operations (keeping the related KPIs under control, first of all the OEE, Overall Equipment Effectiveness that is the overall efficiency of the production resource, a well-known metric that can be adopted, with the appropriate similarities, even to the realities of service companies)
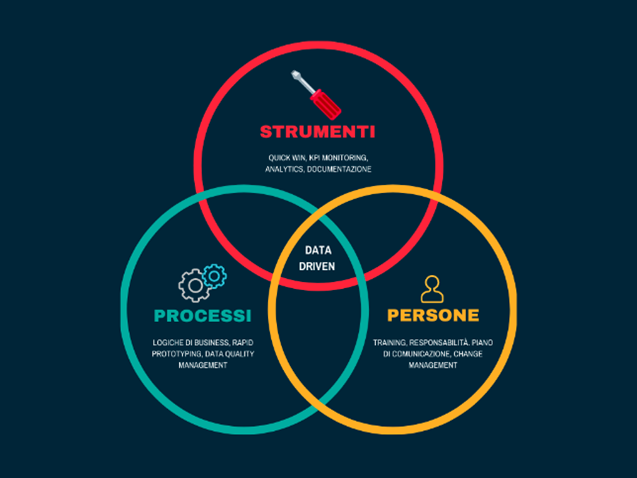
• OT and IT convergence: in the operating environment, IT and OT technologies tend to converge thanks to the use of IP networks.
Even Rai Way, with a view to “digital transformation”, is looking to the future with the study of predictive techniques for maintenance. The development of a predictive maintenance program in the “Industry 4.0” perspective requires a well-designed strategy to assess the working conditions of the equipment and detect incipient failures in a timely manner, which requires effective use of both available sensor measurements and system knowledge.
The program must take into account many factors, including:
• the observed sources of failure and their relative frequency: these sources can be the main components of the machine, its actuators or its various sensors
• the availability of process measurements via sensors: the number, type and location of sensors
• how the various sources of failure result in observed symptoms: this cause-and-effect analysis may require extensive processing of data from available sensors
• physical knowledge of systems dynamics: this knowledge can derive from simulations or from the knowledge of domain experts
• the objective of maintenance, such as restoring faults or developing a maintenance program.
The study of the algorithm is fundamental for the prediction of the anomaly.
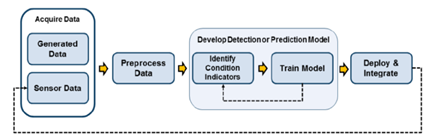
Starting from data that describes the system in a series of healthy and defective conditions, it is necessary to develop a detection model for monitoring operating conditions. The development of such a model requires the identification of appropriate condition indicators and the formation of a model to interpret them. It is very likely that such a process will be iterative for different condition indicators and different patterns until the best model for the application is found. Finally, the algorithm can be implemented in field equipment for monitoring and maintaining machines.
Design begins with a body of data from multiple sensors and multiple machines running at different times and under different operating conditions. The data to be accessed are real data from the normal operation of the system, in defective conditions and from system failures (RTF or run-to-failure data, as indicated in the RCM methodology).
A key step in the development of predictive maintenance algorithms is the identification of condition indicators characteristic of the system, data whose behavior changes predictably as the system degrades. For example, you can monitor the condition of a generator set or pump using operating noise. The incipit of the fault, identifiable at point P of the PF curve, causes changes in the frequency and extent of vibrations.
At the heart of the predictive maintenance algorithm is the detection or forecasting model. This model analyzes the extracted features to determine the current conditions of the system.
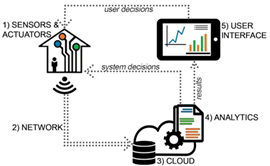
Once you have identified a working algorithm and processed appropriately for generating a forecast, you must deploy it and integrate it into the IOT platform. The trend of the IIOT market is to run the algorithm on the “edge”, that is, on embedded devices closer to the machine to be controlled.
Fonte: https://hackmd.io/@iotmic/tinyml1010
In this mode the amount of information sent is drastically reduced as the data is transmitted only when necessary and updates on the status of the equipment are immediately available without any delay, eliminating the need to transfer data between the cloud and local equipment that perform the prognostic monitoring algorithm, making the control process more effective, efficient and above all less burdensome.
The Rai Way use case
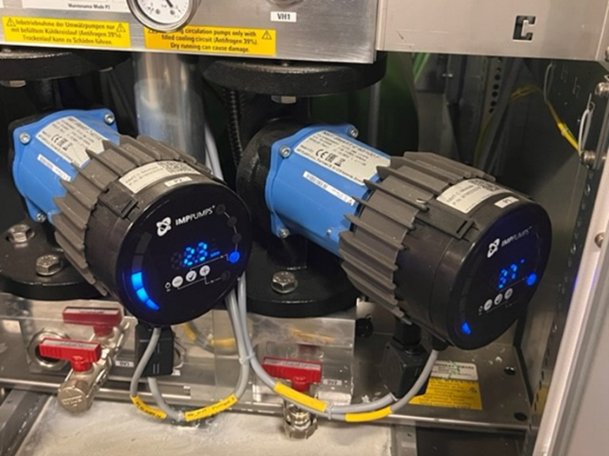
The analyzed use case refers to the audiometric analysis of the operating conditions of a liquid cooling system of a DTT transmitting system, consisting of a water/glycol exchanger with a redundant system of pumps, via an IIOT system equipped with a built-in MEMS microphone. The idea comes from the collaboration with an Indian engineer from Valeo, Mr. Sivan Manivannan and from the collaboration with Professor Emanuele della Valle during my master’s degree in “Data Science & Business Analytics” at the Graduate School of Management of the Politecnico di Milano.
For the collection and analysis of the data, a microprocessor system equipped with embedded microphones was used. Recent advances in microprocessor architecture have made it possible to run sophisticated machine and deep learning workloads on even the smallest microcontrollers. Edge learning, also known as TinyML, is the field of machine learning when applied to embedded systems and allows important advantages in deploying machine learning algorithms on such devices:
• bandwidth: Algorithms on edge devices can extract meaningful insights from data that might otherwise be inaccessible due to bandwidth constraints
• latency: On-device models can respond in real time to inputs, enabling applications that would not be viable if dependent on network latency
• economy: by processing data on device, integrated systems avoid the costs of transmitting data over a network with cloud processing
• reliability: Systems controlled by on-device models are inherently more reliable than those that depend on a connection to the cloud
• privacy: When data is processed on an embedded system and is never transmitted to the cloud, privacy is protected and there is less chance of abuse
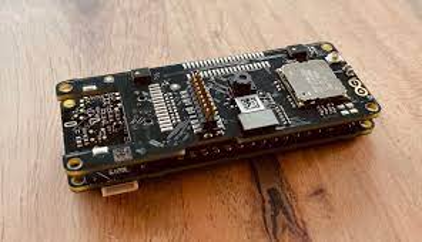
The IIOT system chosen supports the TinyML and is the latest addition to the Arduino family: it is the Portenta H7 with a micro STM32H747 dual core Cortex M7 at 480 MHz and an M4 core at 240 MHz, equipped with two MEMS microphones with beamforming having 64 dB of S/N and omnidirectional sensitivity, a camera with resolution up to QVGA (320x240) and consumption less than 2mW.
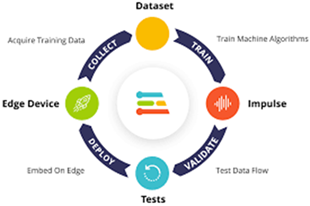
The algorithm was created via the Edge Impulse web app (https://www.edgeimpulse.com/). They were considered audio sequences sampled at 16kHz with a time length of 10s. The web application, for each sample, extracts a spectrogram from the audio signal using “key features” of the Mel-Filterbank Energy (MFE) type, used for non-voice audio systems. In practice, the MFE block transforms an audio sample into a table of feature data in which each row represents a frequency range and each column represents a time frame. The value contained in each cell reflects the amplitude value of the associated frequency range during that time interval. The spectrogram shows each cell as a colored block, the intensity that varies depends on the amplitude. The MFE time/frequency “features” from the considered signal are obtained by applying a sequence of triangular filters on a Mel scale, where the idea is to extract more features in the lower frequencies and less in the high frequencies, adapting well to the sounds that can be distinguished from the human ear.

Once the characteristic features have been determined, the web app transfers them to the neural network in a deep learning configuration. For this purpose, a 4-level CNN with 2D convolution is used followed by a “flat” level with a two-class class classifier output: normal, abnormal. The classifier produces a “confusion matrix” with an accuracy of 98.3% and F1 of 0.98. After the verification phase of the goodness of the model via software, the algorithm was loaded on the IIOT device and tested in the field with satisfactory results.
The “lesson learned”
With the experimentation illustrated, Rai Way Operations have made the first of the long journey towards the “data-driven company” path. However, the tortuous path of the digitalization of industrial processes can only be reached when people are an integral part of the evolutionary scenario. If the aim is to make the entire system efficient and flexible, then it is necessary that all the elements are orchestrated in an appropriate way, especially men, who cannot be replaced, but rather induced to cover different roles provided that new skills are developed for a different and optimized human-machine interaction.